APS (Forge)
-
This has been a strange week, at least in terms of dreams. I mentioned earlier in the week (on Twitter and LinkedIn) that I'd had a dream about Autodesk University where I was only partially present: I was running between meetings while everyone else was having fun attending sessions and hanging out at social events. I also noted this wasn't so very different from reality (at least the way I perceive it), but that's just me playing the victim. I love AU even if it's always a bit hectic. I have a feeling this dream was probably triggered by last…
-
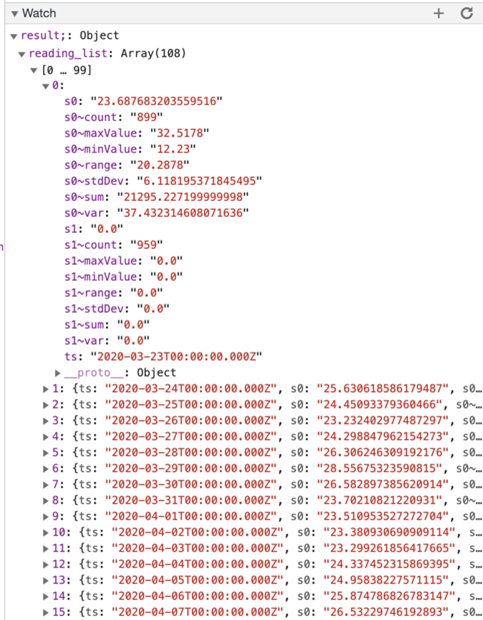
Last week I posted about how roll-ups in the time-series back-end used by Project Dasher enable some interesting visualization opportunities. When my colleague Hali Larsen saw the post, she made a really interesting suggestion: It would be cool if the user could select whether the heatmap visualizes the Max, Min, or Average of the data for the selected rollup. (Yet another drop down...) The advantage would be that someone looking for a feature in the data would see the "spikes" whereas when you use the rollups as they currently work you lose a lot of the variability of colour due…
-
When we started developing Dasher in late 2009 – back then it had a desktop client – one of the main drivers was around providing an interface to explore IoT data (at the time measuring building performance) responsively in a 3D context. To do this we knew that we needed some way to summarize the raw sensor data at different levels of detail: there was no way we could wait around for the client to query years of sensor data in order to visualize a high-level summary, for instance. In our time-series back-end the team developed a mechanism we refer…
-
Since starting up back in 2013, the AEC Hackathon team has organised 43 in-person events in various cities around the world. This year being "special", they've taken the plunge and set up a couple of online events, the first was held from July 6th-26th while the second will be held from October 9th-25th. I was on holiday for the first two weeks of the July event, so could only really participate by presenting a topic during the final week. Here are a couple of screenshots of me – taken from the session recording, which should still be available on-demand –…
-
These days I belong to the Research Engineering team at Autodesk, headed by Tony Ruto. (Tony joined Autodesk with the acquisition of Within Technologies, back at the end of 2014, where he was CTO.) Tony's team is a shared resource for the various "Core Science" and "Industry Futures" teams within Autodesk Research: we help develop prototypes and platform capabilities that are used elsewhere in the organisation, and also have members of our team embedded within these other teams. The team is growing, which is quite exciting: there are a number of open positions that I'd encourage you to share or…
-
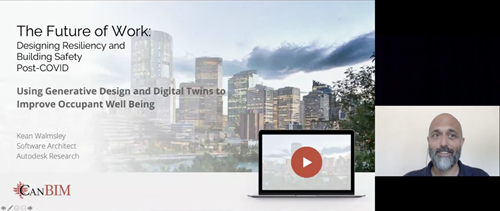
This post is a bit of a grab-bag of various event-related topics. The first one (chronologically, if not in terms of the title above) is the availability of session recordings from the recent CanBIM event: "The Future of Work: Designing Resiliency and Building Work Safety Post-COVID". My own session was entitled "Using Generative Design and Digital Twins to Improve Occupant Well Being". As it was the first session of the day – with a new web streaming platform – there were a few teething issues for the sponsor's introduction (and the session auto-closed a little too promptly, which meant no…
-
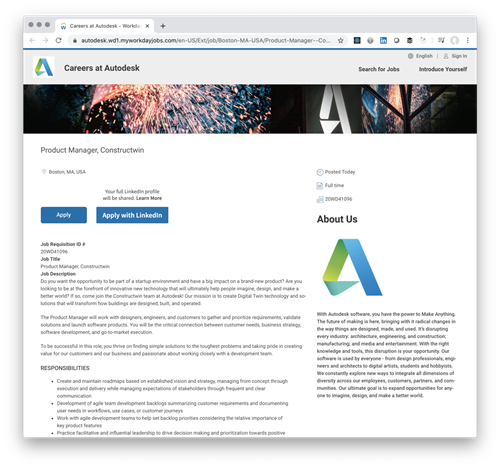
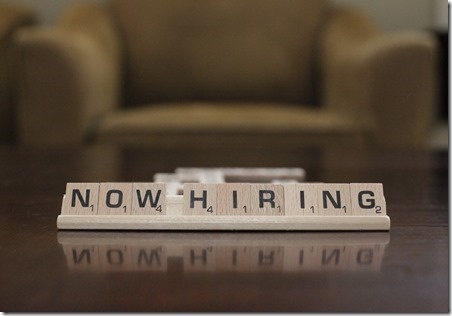
There's an exciting job posted for a key role in a new project (product?) team at Autodesk named Constructwin. Here's some information from the posting: Do you want the opportunity to be part of a startup environment and have a big impact on a brand-new product? Are you looking to be at the forefront of innovative new technology that will ultimately help people imagine, design, and make a better world? If so, come join the Constructwin team at Autodesk! Our mission is to create Digital Twin technology and solutions that will transform how buildings are designed, built, and operated. I…
-
While I announced the sharing feature – and its corresponding API – some time ago, I still had some work to do before it could go live on the Dasher site: largely around supporting timezones properly when specifying time ranges for data display, but there were some other minor tweaks needed, too. Anyway, the feature is ready enough for people to kick the tyres on it, at least. Here's a link which will launch the public Dasher demo for you, taking you straight into a "surface shading" view for C02 values on the 1st floor, bringing up the graph for…
-
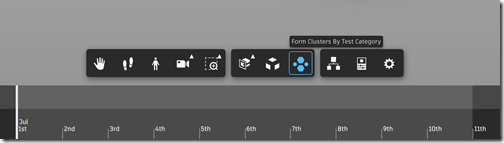
I have a quick update to share on Dasher, today: I've just pushed live a version to the main Dasher site that enables a core Forge viewer extension to perform visual clustering of model contents. I talked about this back at the beginning of the year, but there was a core change needed to the Forge viewer to make it work for Dasher: specific details are in the blog post I just linked to, but it relates to the fact we rely on the Navisworks format for our models, and these have a different property structure when loaded through Forge.…
-

I have the sense that I'm seeing my face too much at the moment (admittedly I'm very attached to it… haha). All I can say, in my defence, is that over the last few weeks I've started to receive more requests to participate in virtual activities. And I've mostly said yes, as it's a reasonable alternative to travelling to meet people, given the current circumstances we're all in. In case you haven't seen these various pieces of virtual content – and you're actually interested – here's a quick round-up of some current and future ones. Getting Simple When my friend…