Dynamo
-
I talked recently about a Dynamo view extension I created to capture presentation graphics (primarily animated GIFs) from the entries in the "hall of fame" of a particular Refinery study. This has been super-useful, internally, but not just for creating fancy graphics. Early on we realised that it was a great way to identify problems in Dynamo graphs: we could see the occasional error state (with the yellow text at the bottom left of the screen) flash past, indicating that a Dynamo run had completed with warnings and/or errors. Presumably the errors haven't stopped the metrics from being evaluated and…
-
A few weeks ago I posted a GIF on Twitter that showed a few images from an earlier version of the Project Rediscover graph. I created this in a very manual, low-tech way: firstly, I selected a number of designs in Refinery, one-by-one, took a screenshot of each and then used GIMP to build an animated GIF. (This used to be very easy to do with previous versions of OS X, by the way: the Preview tool allowed you to drag images across into a GIF file and create new frames, and you could then use GIMP to adjust the…
-
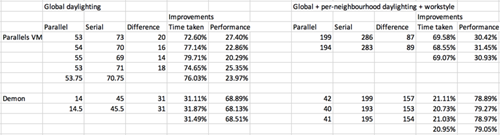
I've mentioned this topic a few times in recent weeks, so it was really time to sit down and put pen to paper (or fingers to keyboard). This one was a lot of fun to dig into, and I think the results will be of interest to people. Parallelism is something that I've been tracking since my studies during the 90s: I remember programming transputers using a programming language called occam, way back when. I was really happy when – around a decade ago – Microsoft got serious about tackling asynchrony and concurrency with F#'s Asynchronous Workflows and the .NET…
-

A video of the final project presentations and the awards ceremony from the recent Dynamo and Generative Design Hackathon in London has been posted to YouTube by the UK Dynamo User Group. It's a great way to get a sense of the various projects at the event, something a number of people have asked me about. I was only really there to help kick things off and answer initial questions about using Dynamo with Refinery to implement Generative Design workflows, so it's fantastic to see how things ended up. If you have follow-on questions about the various projects, I suggest…
-

Today the call for proposals opens for AU 2019 – and its accompanying Forge DevCon – in Las Vegas. I was informed of this fact by an email which very creepily contained a photo of me describing something or other with my hands. (Jeremy Tammik speculated that I was once again talking about zombies. 🙂 As one door opens, another one closes: this is also the last day you can submit classes for AU Germany and the Forge DevCon in Darmstadt. It's important to note that AU Germany is a German-language event, while its DevCon is in English. Here are…
-
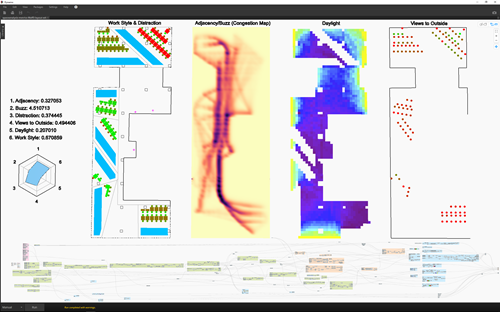
The last few days have been a lot of fun, as some of you will have noticed on my Twitter or LinkedIn feeds. Since the last post, where I announced the fact we've been working on Project Rediscover, I've spent quite a bit of time reworking the graph to have more reusable chunks. Here's a recent snapshot of the graph: In the last post, the subgraph that generates text for the metrics and the radar chart as geometry – both to the right of the image – was hardcoded to the exact metrics we were dealing with. To make it…
-
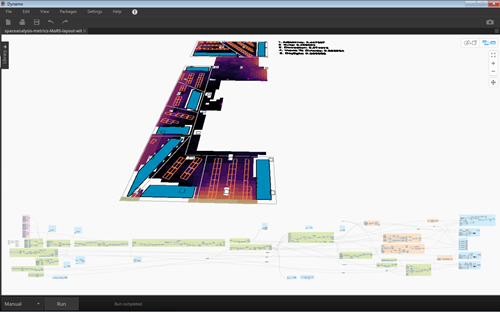
I've talked before about Project Discover: the project where The Living used generative design to explore layout options for the new Autodesk office in the MaRS district of Toronto. As the project was run before Project Refinery was available – and so didn't make use of a Refinery-compatible graph – we've been working on a new iteration of the tool that can be used with the Autodesk GD toolset for AEC workflows (i.e. Dynamo + Refinery). Internally we're affectionately referring to this project as Project Rediscover. Things are moving along well: thanks largely to the Space Analysis package (and yes,…
-
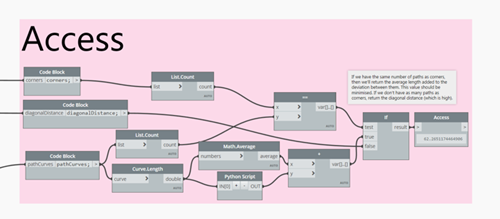
As a follow-up to this recent post, I decided to add a couple of metrics to the previous graph and try it out with Refinery. And here's the updated graph for you to try for yourselves. The first metric relates to the pathfinding capability, and I've called it "Access". There are a few things going on, here: for sure we want to measure the shortest average path, but also to disqualify (or at least penalise) designs that don't have paths to all of of our points of interest (i.e. the corners). But I also wanted to weight the results to…
-
Many of you will have been happy to see the extent of the features announced last week for Revit 2020. It's great to see Dynamo 2.1 integrated, for instance: It seems the Dynamo version is being tied specifically to Revit, which is an interesting development. I assume this is driven by the need to manage complexity of end-user environment configuration, but I do wonder whether it will impact the ability for users to absorb changes delivered by the Dynamo team. But that's the trade-off between control and flexibility, I suppose: we'll see how it works out. In addition, the new…
-
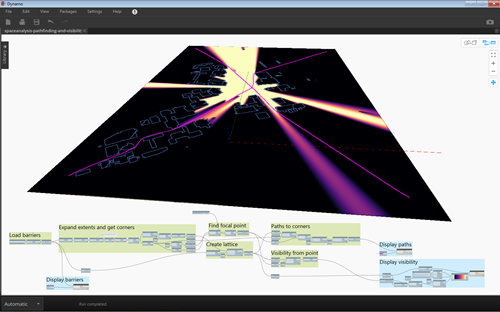
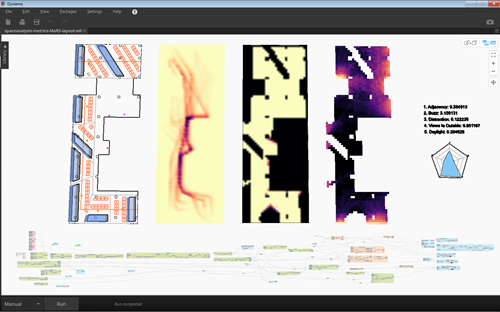
I've been meaning to create a post introducing the use of the Space Analysis package for a few weeks, now, but with various trips it's been impossible to find the time. Anyway, here it is, at last. You can start by downloading the graph we'll be walking through in this post. Here's a picture of the graph, with its graphics generated. The graph is fairly simple: it loads some geometry from an SAT file that we'll use as the definition of our barriers for the SpaceLattice. I'm using an SAT file we posted with the campus layout example that defines…