Autodesk Research
-
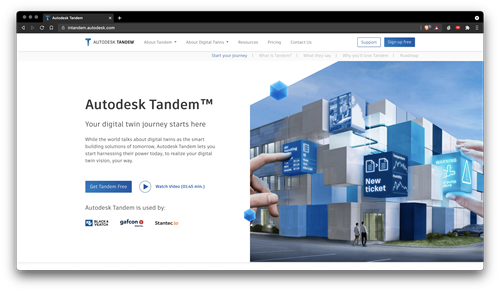
These are busy times in the world of digital twins at Autodesk! I'm thrilled to see the news that Autodesk Tandem has now officially launched. Head on over to the new landing page, intandem.autodesk.com, to find out more, or check out Bob Bray's recent article. A few people have either been congratulating me or asking how this relates to Project Dasher, so I think it's worth clarifying the situation. Tandem is not Dasher, although I'd love to think that the Dasher story at least in some way influenced or inspired Tandem's trajectory. Tandem solves a fundamental industry problem that we…
-
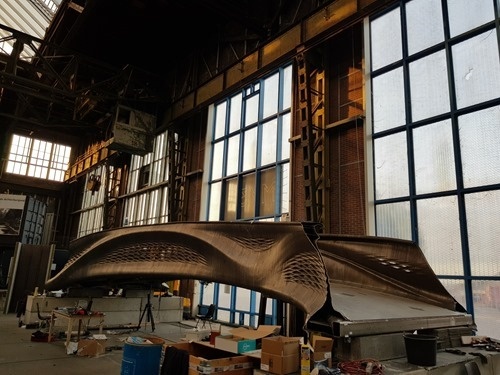
Now that the weekend has passed and the football is over for another year or so (for me, anyway, as I only pay attention to major tournaments), I thought I'd share some of the work that was done last week on the MX3D bridge, and what's planned for this coming week. The major work done on Friday was to raise the bridge (allowing access to the current foundations) and to start the job of lowering it. Sometimes you have to go up to go down. I was impressed by the fact the bridge could be raised – one end at…
-
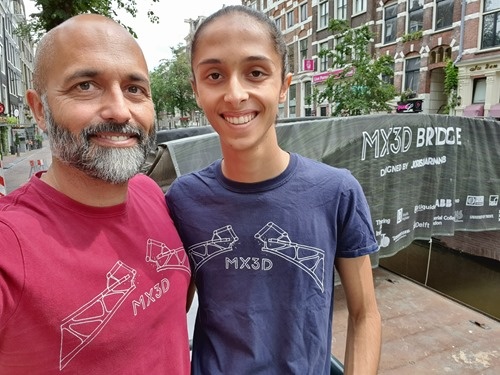
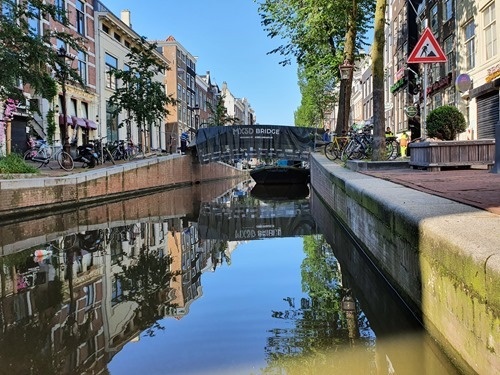
It's now Thursday night, and tomorrow morning we'll be heading home from Amsterdam. As with any project, some things haven't gone quite as smoothly as they might, but more on that in a bit. My son and I proudly donned our MX3D T-shirts for this morning's pic: Here's another shot from the bridge itself, looking down the canal. Now for some information about the main issue currently impacting the project. Here's a video I took while on the bridge, that shows a quick walkover and the canal views. As you can see, there's an issue with the clearance between the…
-
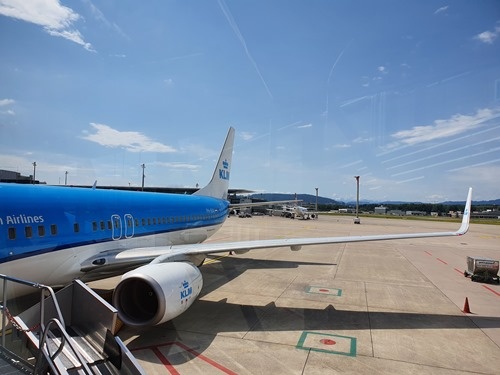
This morning I headed with our eldest son (he'll be 17 in just over a week – how did that happen?) to Zurich airport to catch our first flight in what seems like forever to travel to Amsterdam to see the MX3D bridge being installed. Even catching the train was surreal: I've certainly done so, during the pandemic, but only for personal trips. My usual habit of grabbing breakfast in the dining car didn't go so smoothly when I realised I could no longer remember the PIN for my corporate card. Luckily I could go contactless – SBB breakfasts are…
-
This weekend I had a very strange task to perform: I had to book travel for work. Remembering how our corporate travel system worked was just one hurdle to cross – beyond that I had to deal with getting the appropriate management and travel department approvals, along with the fact I've booked a separate ticket for my 16-year old son to come along, and wanted to be 100% sure that we're on the same flight. Was life really this complicated pre-pandemic? I'm sure I'll get used to it all again, before long. The reason I'm travelling is pretty exciting, at…
-
I've been heads-down on a side project to integrate a C++ library into Forge using Web Assembly (hopefully I'll share more on this sometime soon). Thankfully while I've been busy on that, the Hyperion team has been beavering away on some changes to their core shader. Last week I realised – now that we have controls to adjust the confidence and power settings in the shader – that rooms with just one sensor have a uniform shading style. This was a deliberate choice we made, back when we initially implemented the shader, as we felt it would help highlight the…
-
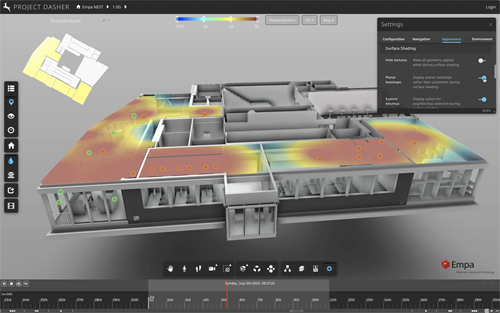
In the first post in this series we looked at how a heatmap can be used to shade an object using the Forge viewer's Data Visualization Extension – or Project Hyperion. In our case we shaded the surface of the MX3D bridge. In this post we look at a slightly different use-case for this mechanism, where we want to shade a piece of geometry inside the model based on the value of a particular sensor. To be clear: this is about shading the entire object a uniform colour that varies based on the value of the sensor that's providing the…
-
In a recent post we talked about the integration of Hyperion's planar heatmap capability into Dasher. Towards the end of that post, I mentioned that the Hyperion team was looking into exposing some way to place planar heatmaps not only at the minimum and maximum vertical locations in the bounding box, but at levels in-between. The team has delivered this more quickly than I expected, and you'll be able to try it for yourselves in v7.45 of the Forge viewer. While I was adding the sliders needed for the capabilities shown in the last post, I went ahead and added…
-
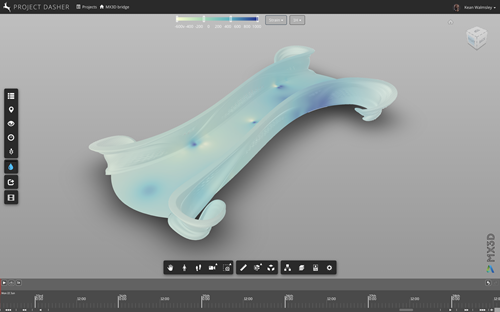
Over the next few posts – in this series, anyway – we're going to take a look at the shading of objects (actually meshes) using the Forge viewer's Data Visualization Extension (Project Hyperion). This is something we've done in Dasher for some time, and I was excited that using Hyperion would once again allow us not only to rip out some of our old code but also to go in new directions and explore interesting new capabilities. Let's first explain how this type of shading differs from what we've seen in previous posts, namely volumetric room and planar shading: simply…
-
Having spent time recently looking at integrating sprites and volumetric room heatmaps into Dasher, today we move on to a capability that we didn't have previously but has been enabled by Project Hyperion (i.e. the new Data Visualization Extension for the Forge viewer): planar heatmaps. Planar heatmaps do just what you'd expect: they display a heatmap for 3D geometry in a plane. This means you can display a heatmap on the floor or ceiling of rooms, or place them on tables or work surfaces. They might – for instance – be used to indicate usage of an area, such as where…