Autodesk Research
-
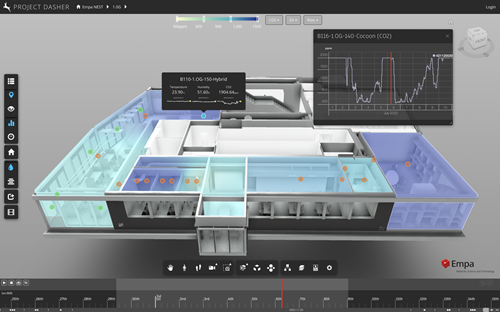
The big news from this week (for me, anyway, aside from a very enjoyable Star Wars Day, yesterday) is that Project Hyperion has been released officially to the public as the Forge Viewer's Data Visualization Extension. All you need to do is to use it is to start making use of the Forge Viewer from v7.42 (it is available in earlier versions, but this is the most complete version) and then take a look at the extensive online documentation. Congratulations to the Hyperion team for this major milestone! The work that has been done by that team to engineer and…
-
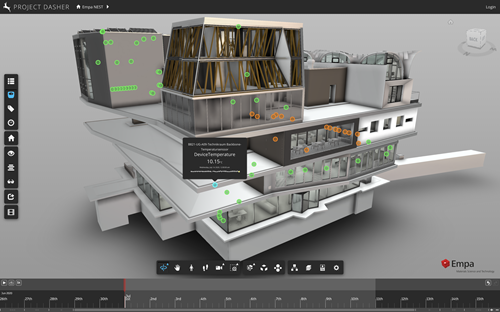
As mentioned on Monday, I've been having lots of fun getting Hyperion to work inside Dasher, this week. All good preparation for the AU class I hope will be accepted for this year's conference. Right now I have sprites working, which is an important first step (and doesn't actually involve any of the more gnarly, data-related issues I expect to have when w tackle surface shading/heatmaps). In this post we're going to step through the main steps taken to make this happen, but also to describe some of the important changes that were needed to make it all work well.…
-
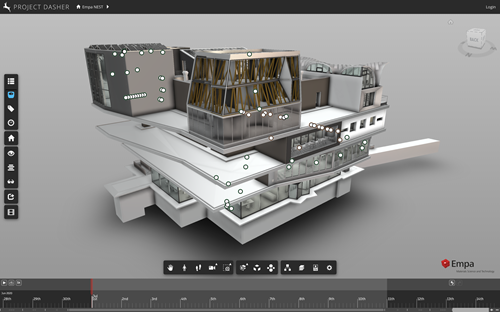
On Friday I went ahead and submitted my one and only class proposal for the all-digital Autodesk University 2021. Let's hope it gets selected. In case you're interested, here's the content of the proposal: Title: Dasher and Hyperion: using Data Visualization in a Forge viewer application Class ID: SD500020Product(s): ForgeTopics: Building Information Modeling (BIM), Building Operations, Internet of Things (IoT), Software Development Session Description Autodesk Research started Project Dasher in 2009 to explore the possibilities around integrating IoT data with BIM. In 2016 it was ported to work on the Forge platform, to understand the feasibility and potential for such…
-
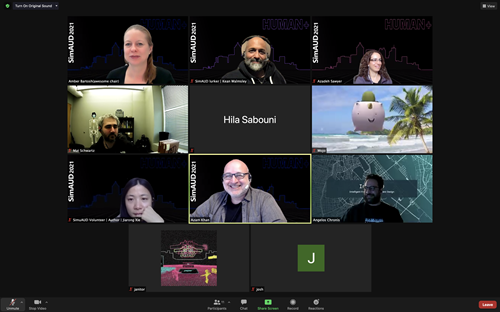
As mentioned last week, this year's Symposium on Simulation for Architecture and Urban Design (SimAUD) was held on Friday and Saturday of last week (with some pre-conference workshops on the Thursday). Autodesk has supported SimAUD since its inception – in fact a number of the people who started the conference were working for Autodesk Research at the time – and we continue to be a proud sponsor of the event, I'm pleased to say. It's great that our sponsorship helped this year's SimAUD be free to attend, as it encouraged record numbers of registrants (500+!) and attendees. If you weren't…
-
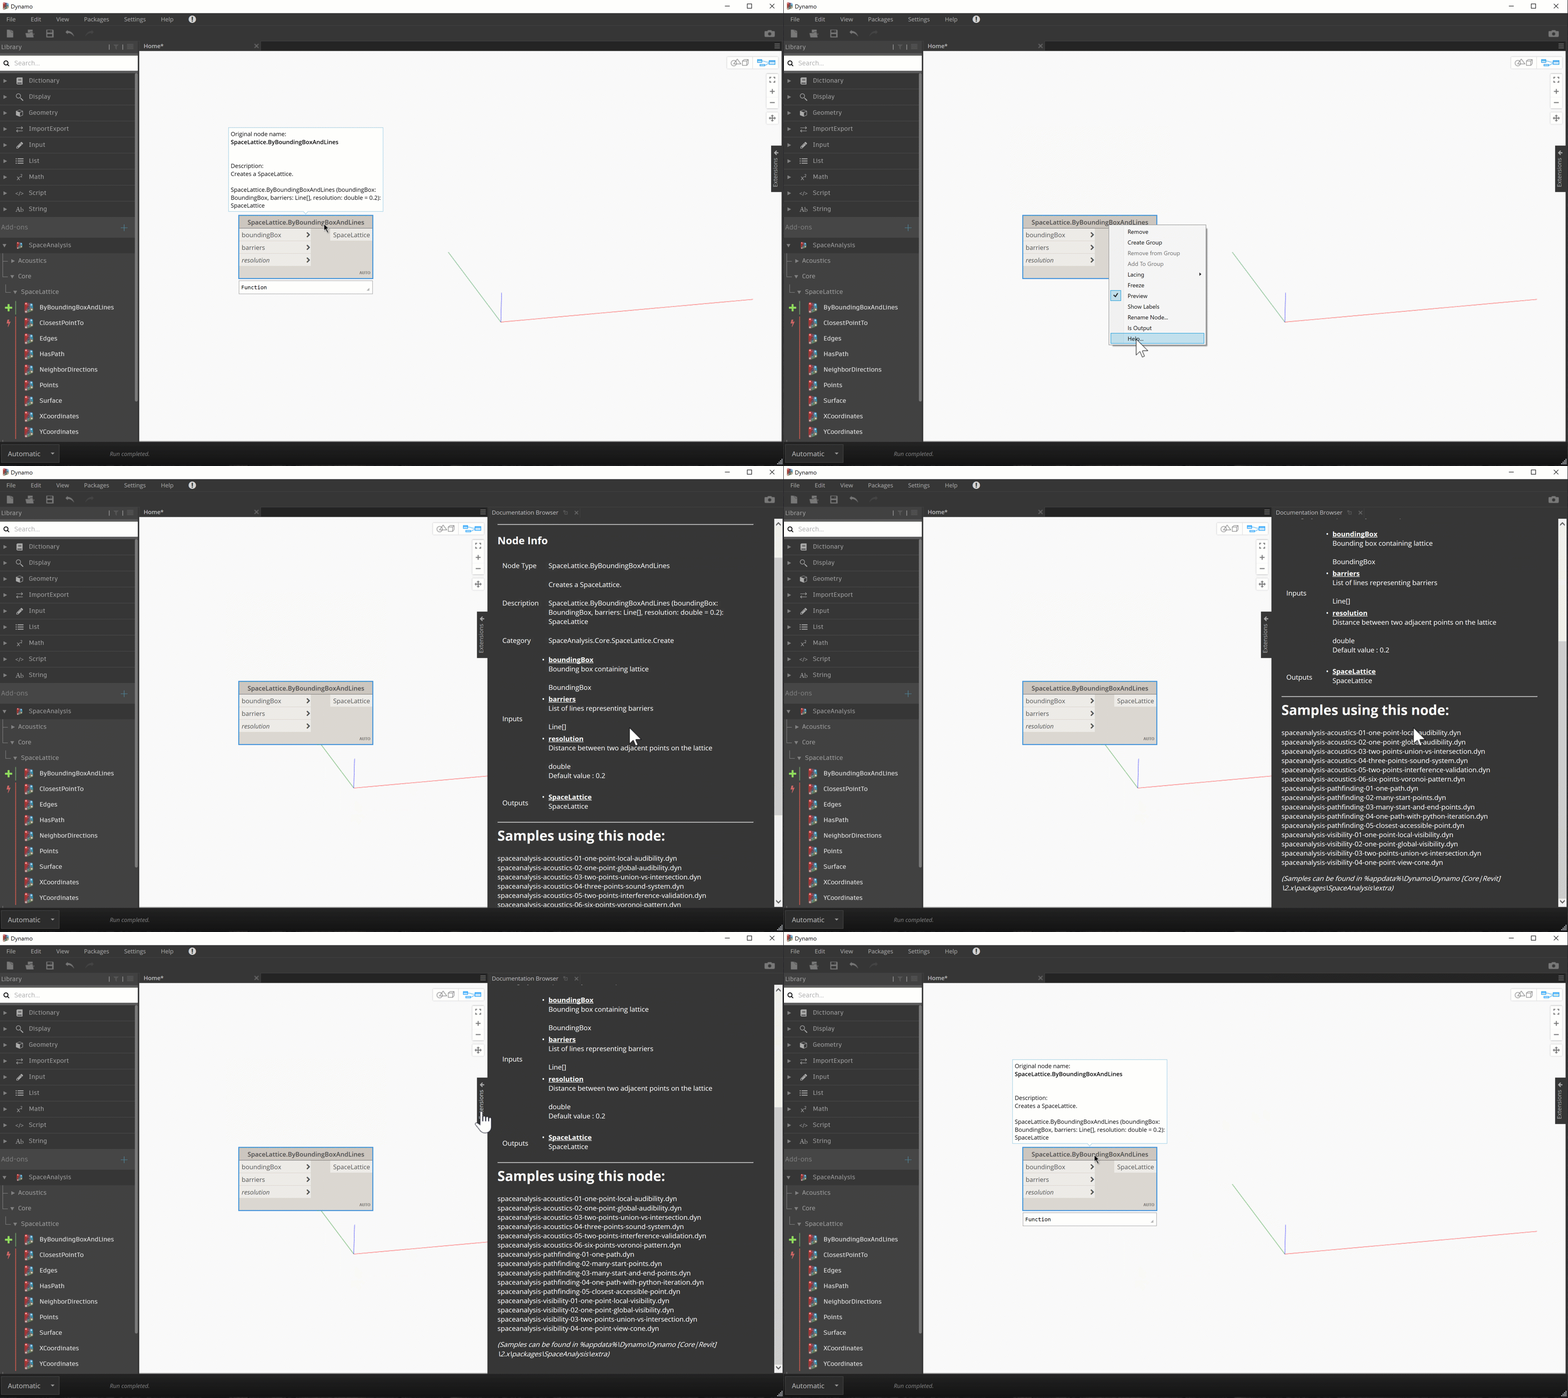
I mentioned last week that Dynamo 2.11 allows package owners to add additional documentation for their nodes via the enhanced Documentation Browser. I decided to give it a try, and then decided to test the possibilities around automating the process. Here's the idea: the Space Analysis package comes with 15 different samples showing how to use its various nodes. These are all hidden away in the %appdata%\Dynamo\Dynamo [Core|Revit]\2.x\packages\SpaceAnalysis\extra folder, so lots of people don't know they exist. What if the Documentation Browser told you about the samples that use a particular node when you pull up its help? Here's a…
-

The Forge viewer team is seeking to hire a San Francisco-based Senior Product Owner for Project Hyperion, the technology being made available as the Data Visualization Extension. (If you're not familiar with the term Product Owner then in fairness you're probably not a good fit for this position – the successful candidate will have PO experience – but here's a link that may be of interest to you if you want to understand more about what's involved.) This team is part of our Engineering organisation, but there are certainly connections to the work we're doing over in Research: they took…
-

Last week Autodesk's Developer Advocacy and Support team organised their second Forge Accelerator where developers could prototype Digital Twins using the Forge viewer's Data Visualization Extension (codenamed Hyperion). The first of these Accelerators was back in December: while these virtual Accelerator events are currently held monthly, the Hyperion team needed some time to integrate the feedback from that event, so this was really only the second opportunity to focus on this new capability. I was a little busy last week (mainly with attending and speaking at the AI in AEC 2021 conference, which I found very interesting), so I wasn't…
-

I've just heard that the Call for Proposals for Autodesk University 2021 goes out next week on March 30th. The CFP period is short – it runs until April 30th – so it's already time to don your thinking caps and consider what topic or topics you'd like to talk about at this year's AU. Community voting will be possible as soon as the CFP starts, and will run until May 12th. I'm probably going to submit something related to Dasher and /or Project Hyperion, but I need to plan out what that would look like over the coming weeks…
-
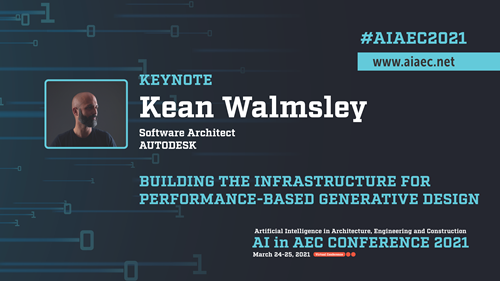
Next week the Finnish Association of Civil Engineers (RIL) is holding a virtual conference on the use of Artificial Intelligence in Architecture, Engineering and Construction called AI in AEC 2021. The agenda looks really compelling. These are the presentation tracks, to give you a sense for the topics covered: Data Driven Design Generative Design Impactful AI Project Management Natural Language Processing Smart Buildings Circular Economy Data Analytics Quality Control & Verification Autonomous Construction There are three keynote presentations: two at the opening of the conference at 10am CET on March 24th, while the third (which I've been asked to deliver)…
-

I'm currently up in the mountains with my family, enjoying the annual school closure for the kids' "ski week". I recognise we're especially lucky, this year, given that a) Swiss ski resorts are open and b) our kids are at school physically rather than remotely. Spring seems to be hitting early, this year, but even if the snow's a little soft, the sun is very welcome. Here's a shot where we're sitting at the top of a run as a rescue helicopter takes off (this is never good to see, but it is often impressive): Yesterday we went to another…