Autodesk Research
-

Earlier this year, the Swiss Data Science Center kindly invited me to deliver a session on generative design at their October 1st SDSC-Connect event, entitled "Enhancing discovery and creativity with AI". A perfect umbrella topic for a session on GD! The event was originally going to be held in-person in Zurich, but with recent developments it became clear that it would have to be held online. This is bad and good, of course: it's bad because I won't get to meet attendees in person – and they sound like a really interesting group of people – and it's good because…
-
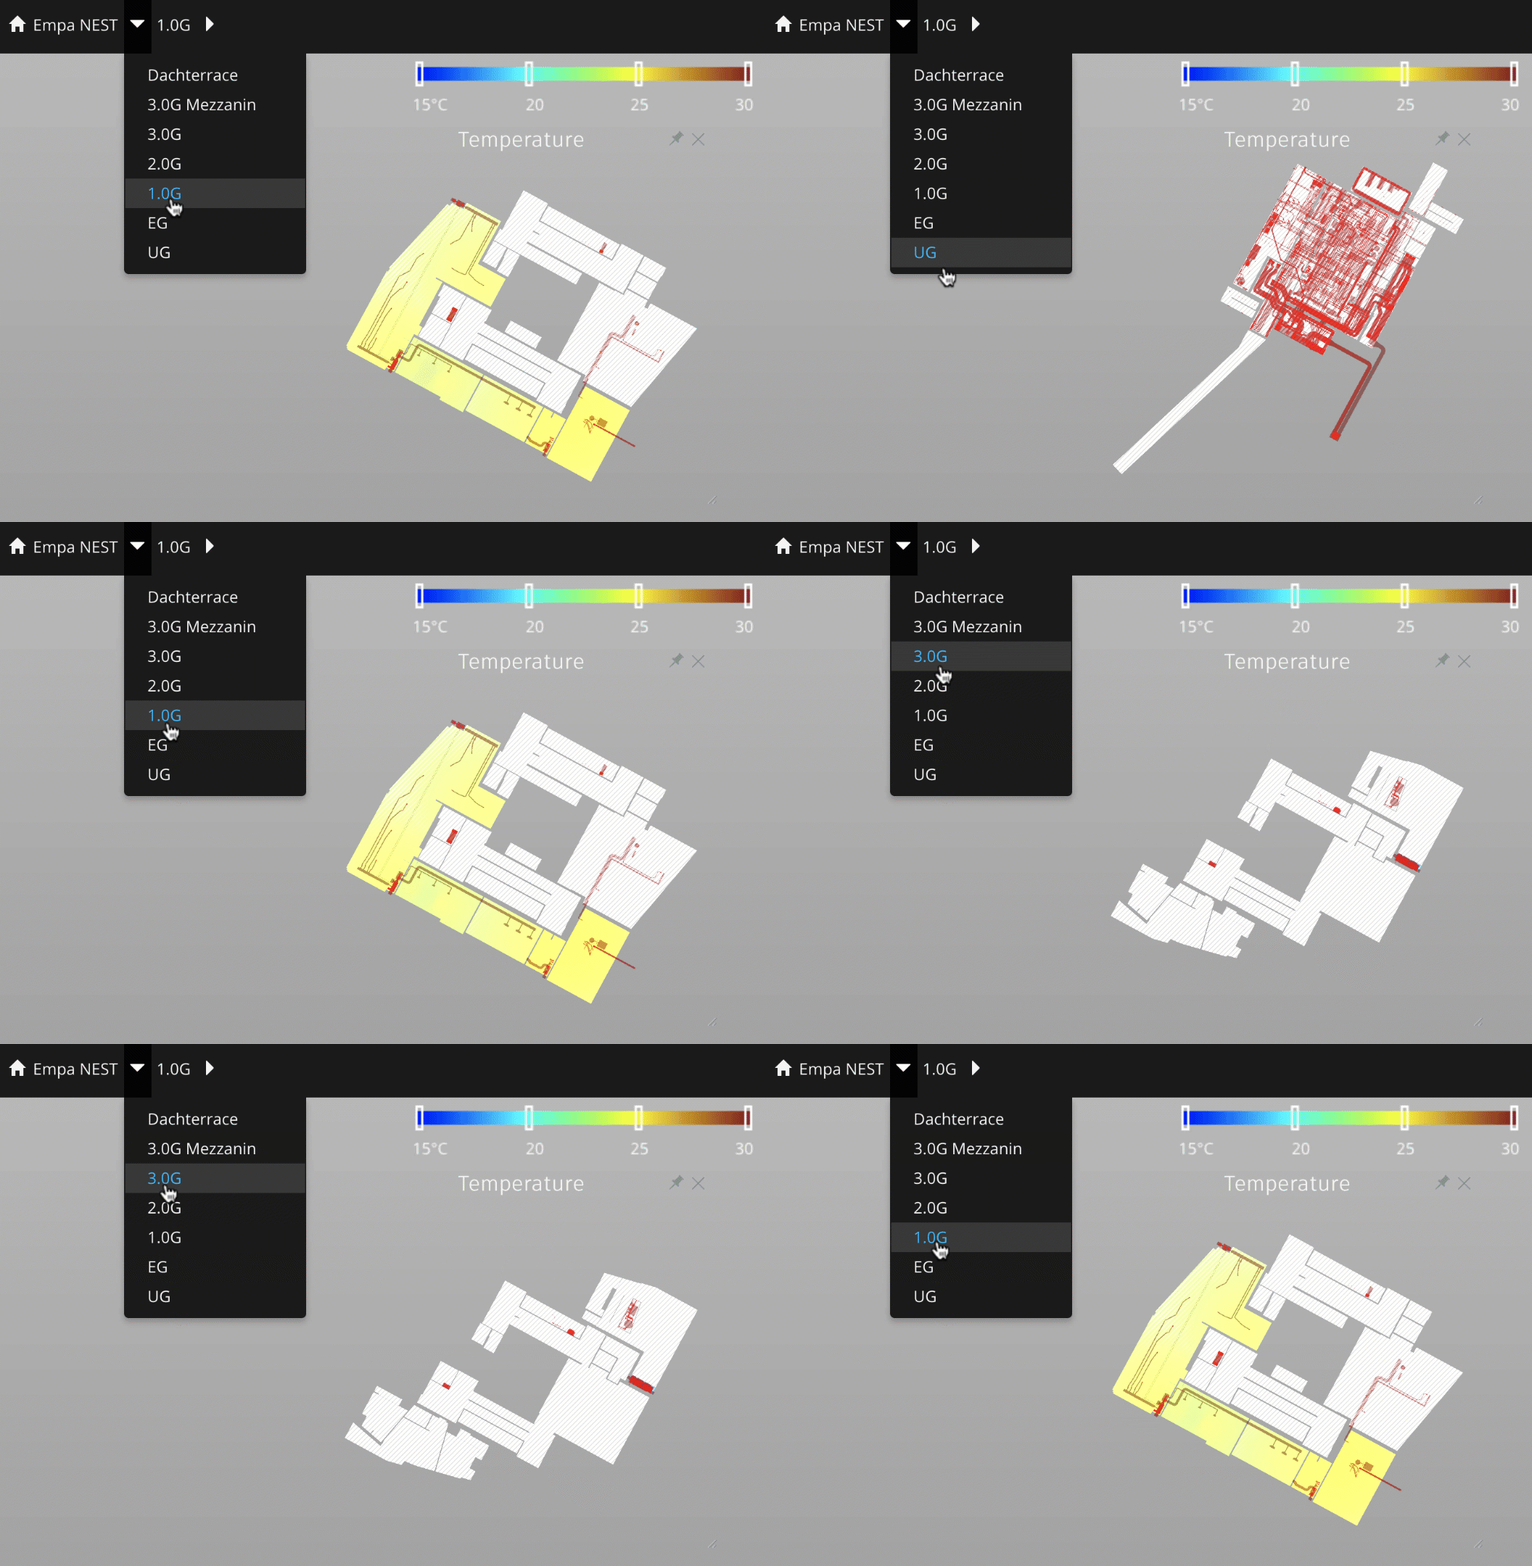
As a recap, so far in this series we've looked at creating 2D heatmaps, making them resizable, adding lots of them inside Project Dasher, and then making them pinnable per-level. There are two main tasks left for the completed feature – which will form the core of my upcoming class for AU2020 – which are to add information on building systems and to implement a UI to make these new views easier to access. Today we're focusing on adding building system information. Let's first step back and talk about why this is important… One of the key insights we've derived…
-

It's been a crazy year, but there's comfort to be had in certain things going ahead despite the craziness. For me Autodesk University is one of these things: my first AU was back in the year 2000, and I've probably only missed a few in the last two decades. This year's AU experience will be 100% virtual but also 100% free, so I'm really excited that so many more people will be able to experience AU! As of Wednesday, registration is now open for this year's AU. It's quick and easy – no need to fill out credit card details…
-

I've been invited to talk about Project Dasher at the KEA BIM Café Talk on Wednesday of this week. Many thanks to Aske Strandberg for organising and moderating this event. It's being held online (of course) at 4pm CET on Wednesday September 16th. The session is primarily targeted at students from KEA – the Copenhagen School of Design and Technology – but guests are very welcome. If you'd like to join, feel free to sign up here. I'll be sharing a number of really cool enhancements I've been making to Dasher during the pandemic-related travel ban – only some of…
-
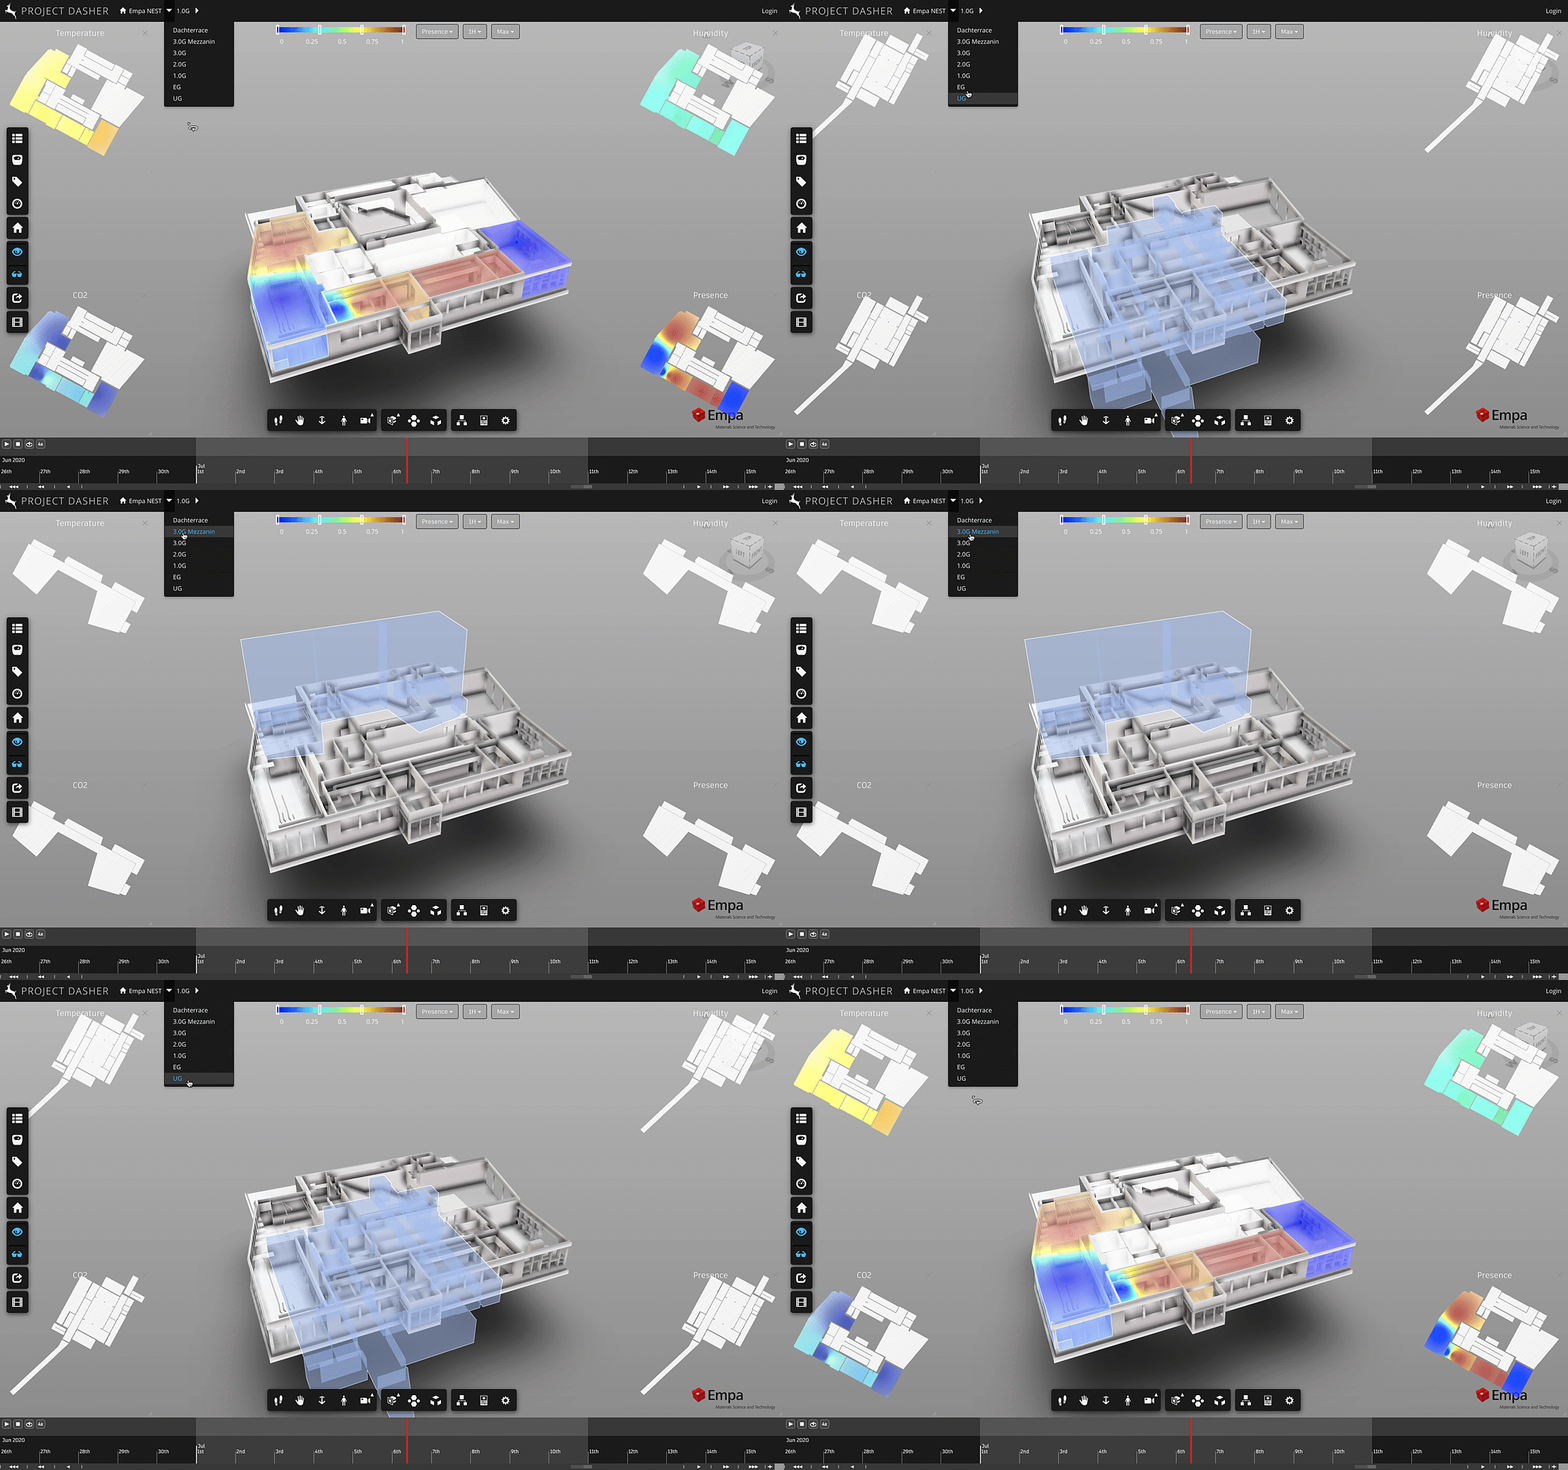
So far in this series we've looked at creating 2D heatmaps, making them resizable, and then adding lots of them inside Project Dasher. I've mentioned a few times – and I've seen the same commented via LinkedIn – that viewing data from multiple building floors at the same time would be beneficial. As a reminder, here's what happens when you change floors with the current implementation: The UX to implement some kind of "pinning" mechanism was non-trivial, but possible. The way I ended up thinking about this was as follows: We still want generic panels that will show data for…
-
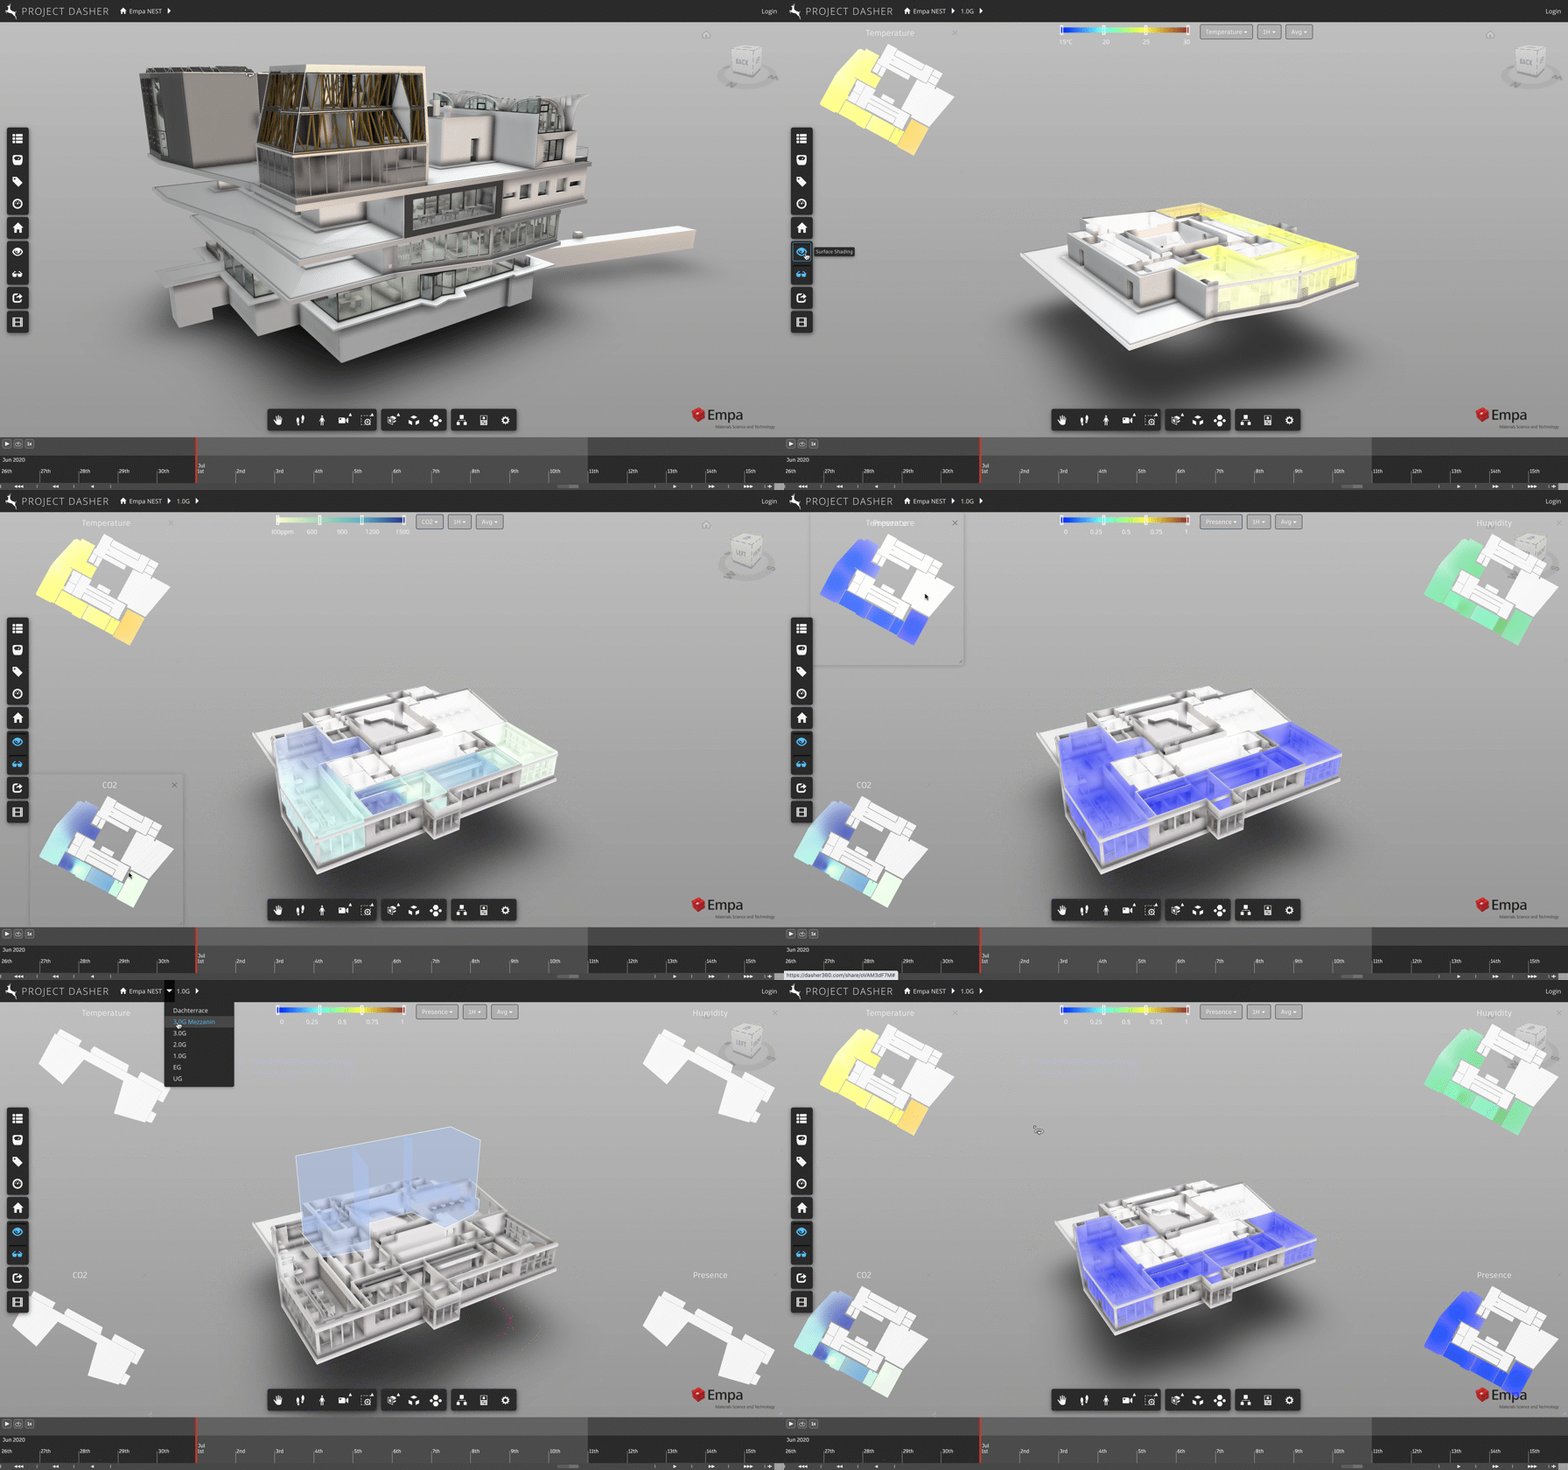
In the last couple of posts in this series, we looked at how we've been able to include a 2D heatmap view inside Project Dasher and make it resizable via a square, transparent panel. This post is really just to let you know that we've now extended the capability to support multiple heatmaps, which is particularly interesting if you want to compare data from different sensor types across the floor of a building. (I often say that the value in a tool like Dasher is in its ability to correlate multiple streams of data – such as occupancy with CO2…
-
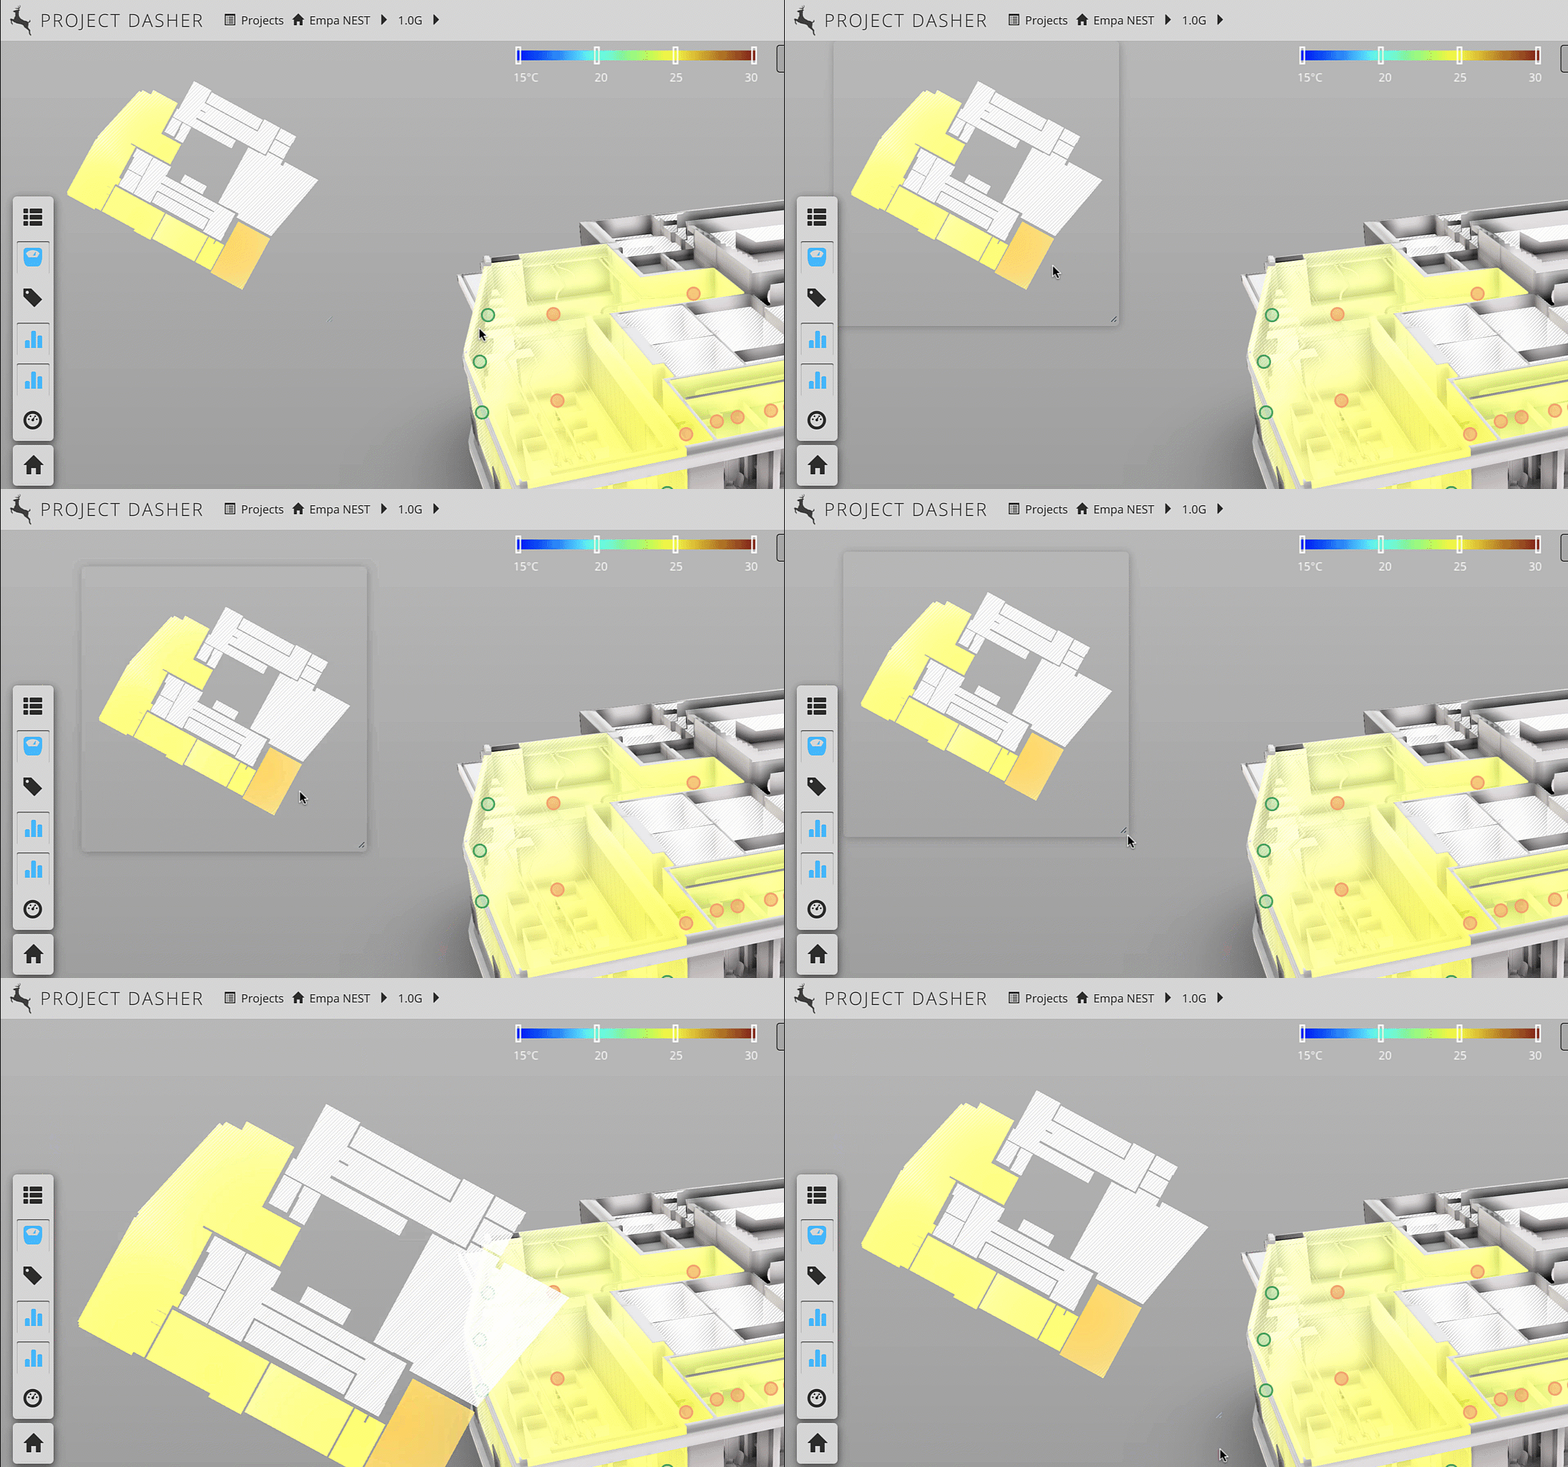
In this recent post we looked at a new 2D heatmap capability that we've added to Project Dasher. In this post we look at what was needed to make this heatmap resizable – but with a fixed aspect ratio – as well as being movable and displayed with a transparent background. Luckily, this previous post shows how to create a transparent, movable window – which we already use to show our surface shading legend – so we were able to use that as a basis for today's implementation. Firstly, let's take a look at it working. Note the fact the…
-
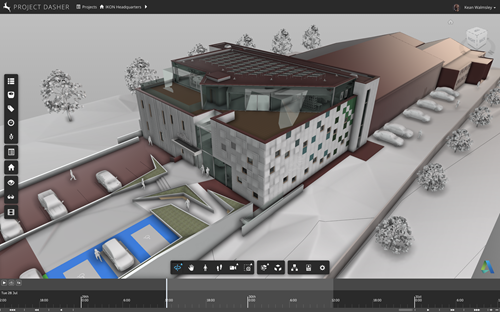
A nice article was published recently on Redshift regarding Kingspan's new IKON building. The article focuses particularly on describing how IKON furthers Kingspan's commitment to innovation and sustainability. In this post I thought we'd look in a bit more detail at how Autodesk Research has been involved in the IKON project, specifically regarding the deployment of sensor and camera technology to help create a digital twin of IKON inside Project Dasher. IKON is Kingspan's new headquarters and global innovation centre at Kingscourt in County Cavan, Ireland. Here's an introductory video that talks about this project and shows a couple of…
-
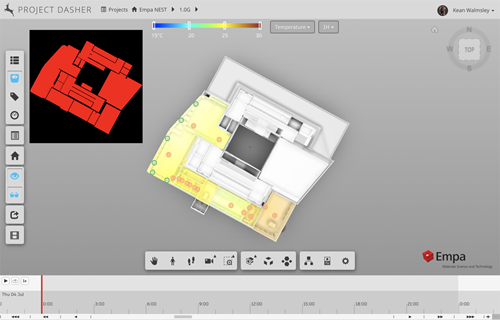
A week or two ago, I had a meeting with some colleagues to discuss future needs for Project Dasher. One of these requirements related to an exhibit where we're going to want to ignore all the 3D visualization of sensor data, and focus on the 2D case (I.e. where we shade a 2D floorplan with the sensor values). When this came up I thought to myself "oh, this could be a good driver for us implementing a 2D workflow inside Dasher", something I've chewed on in the past. This time around, I started off thinking about whether to use a…
-
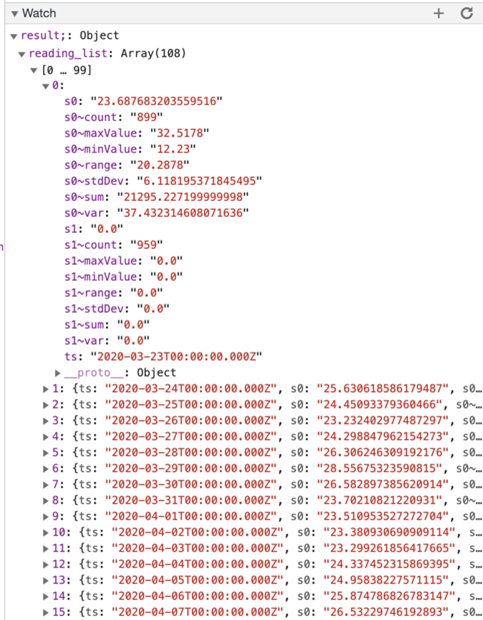
Last week I posted about how roll-ups in the time-series back-end used by Project Dasher enable some interesting visualization opportunities. When my colleague Hali Larsen saw the post, she made a really interesting suggestion: It would be cool if the user could select whether the heatmap visualizes the Max, Min, or Average of the data for the selected rollup. (Yet another drop down...) The advantage would be that someone looking for a feature in the data would see the "spikes" whereas when you use the rollups as they currently work you lose a lot of the variability of colour due…