Debugging
-

One of the highlights of last weekend's AEC Hackathon in Berlin was getting to meet Michael and Keith from the Dynamo team. They'd delivered a pre-event workshop on the Friday and stayed on to tutor the many Dynamo-centric teams participating in the weekend's Hackathon. On afternoon on Saturday Keith and Michael presented an additional session that briefly mentioned Refinery (the optimization engine for Dynamo that's currently in Beta) but focused mainly on the API infrastructure that enabled its integration into Dynamo: the View Extension API. It was really helpful for me to see how it's possible to extend Dynamo with…
-
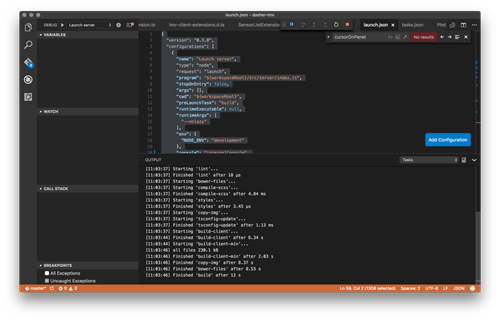
Yesterday I finally took the time to work on one of those tasks that had previously never quite bubbled up to the top of my priority list. Since I've been working on Dasher 360 I've put up with using the developer tools built into Chrome for debugging. While these are pretty good – especially with source-map support, allowing us to debug the source TypeScript code – which is the main reason I haven't taken the time to do otherwise, they do have their limitations: just for instance, you very often start to edit code in the debugger before realising you're…
-
The C++ developers among you may remember the autoexp.dat file, which tells older versions of Visual Studio how to visualize custom C++ types during a debug session. Here's an ancient post showing how we extended it for some basic ObjectARX types and another showing how to do so via a custom plug-in. In Visual Studio 2012, a newer XML-based mechanism was introduced to do something similar. In today's post we'll look at a custom .natvis file that exposes some basic ObjectARX types to the Visual Studio debugger. This file was created by Davis Augustine in response to a query from…
-
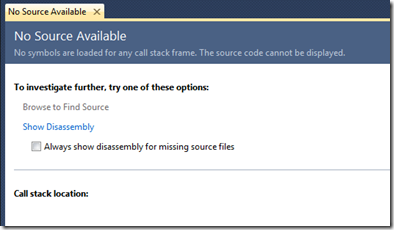
There are lots of reasons to want to use the newly-released Visual Studio 2013 to develop and debug .NET modules for AutoCAD. One of the main ones is the long-awaited addition of Edit & Continue support for 64-bit applications. Unfortunately in this post we'll see why, despite the wait, E&C isn't going to work when debugging 64-bit .NET modules inside AutoCAD. The primary issue when running AutoCAD from the VS2013 debugger manifests itself in issues with font loading. If you launch AutoCAD from VS2013 to debug a 64-bit class library – even without actually loading the module – then AutoCAD…
-
As a follow-on from the last post, in today's we're going to look at a crude approach for collecting execution information about functions of your choosing from a .NET app inside AutoCAD. We're going to extend the implementation shown last time to record the time taken for the various "instrumented" commands to execute and make it easy to copy and paste this "performance" data into a tool such as Excel. We could also dump out a file directly that can be imported into Excel, but this way is simpler and only slightly more manual. It's important to note the quotes…
-
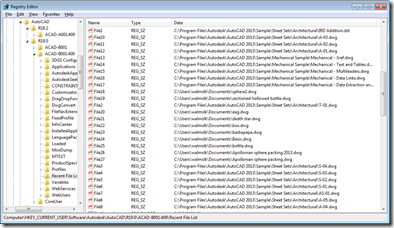
Inspired by the Windows 8 conference I attended on Monday, I've decided to build my first Metro-style application which scrolls through AutoCAD's Most-Recently-Used (MRU) drawing list. I now have a barebones installation of the Windows 8 Consumer Preview + VS11 Beta inside a Parallels VM on my Mac, but rather than installing AutoCAD into that, I decided to write a simple exporter on my existing Windows 7 machine (which now has AutoCAD 2013 installed) to generate the data for my Metro-style application. Let's start by looking at what file-oriented MRU data AutoCAD stores, and where. At the end of each…
-
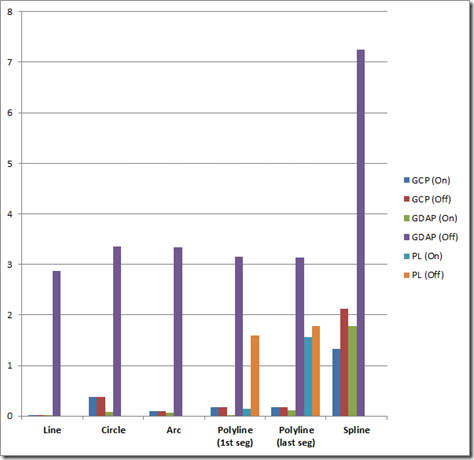
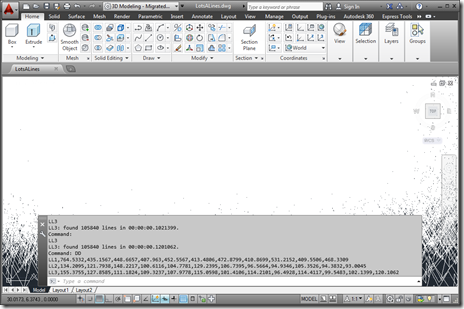
A couple of recent posts have covered different ways of checking whether a point is on a curve. This post looks at a rudimentary way of profiling the relative performance of these various methods, in order to determine the best approach to use, in general. There are various performance profiling technologies available on the market, but given the specificity of the cases we wanted to test and compare, I rolled my own very simple approach. Nothing at all earth-shattering, just a helper function that will call one of our methods (passed in as a delegate with a specific signature) a…
-
Given the fact AU 2011 is quickly approaching, I decided it was time to dust off my Kinect-related code and getting it working with the Beta SDK from Microsoft Research. Part of the reason I haven't been able to do this sooner is that my primary work machine is currently a MacBook Pro running Windows 7 via Parallels, and the Microsoft Kinect driver currently does not support working inside a Virtual Machine. I did start to try to get my previous implementation using OpenNI + NITE to work on this system, but as it uses the nKinect component that is…
-
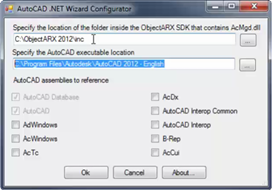
Visual C# Express and Visual Basic Express can be used successfully to build .NET applications for AutoCAD: in fact many developers use these tools to do so. One long-standing issue with using these tools with AutoCAD relates to debugging: the ability to debug using an external application is not directly exposed via the user interface Visual C#/Basic Express, which – as AutoCAD implements a plug-in hosting framework for .NET Class Libraries (or DLLs) – makes life complicated. The workaround for addressing this issue has been documented in this previous post and also on the ADN web-site, but thankfully this manual…
-
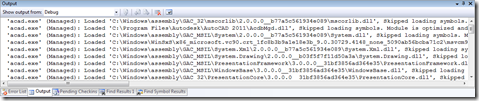
Thanks for George Varghese and Albert Szilvasy from the AutoCAD Engineering team for this helpful tip (culled from an internal email discussion). If you've ever wondered how to reduce the noise AutoCAD makes in Visual Studio's output window while debugging – at least since AutoCAD 2009, when we integrated WPF for user-interface components such as the ribbon – then this post will be of help to you. Here's the window we're talking about, which fills with messages from the application being debugged (in this case AutoCAD, whose acad.exe needs to be listed in the Debug properties under Start external program):…